Du betrachtest gerade Standard Deviation Indikator: Trading mit Volatilität 

Standard Deviation Indikator: Trading mit Volatilität 

  • Beitrag zuletzt geändert am:25 Januar 2024
  • Beitrags-Kategorie:Technische Indikatoren
  • Beitrags-Kommentare:87 Kommentare
  • Lesedauer:25 min Lesezeit

Was ist der Standard Deviation Indikator und wie funktioniert er?

Der Standard Deviation Indikator misst die Volatilität eines Vermögenswerts. Indem er die Streuung der Schlusskurse um einen gleitenden Durchschnitt berechnet. Hohe Werte deuten auf starke Preisbewegungen und hohe Volatilität hin. Niedrige Werte zeigen geringere Schwankungen und Stabilität an. Dieser Indikator hilft Tradern, Marktrisiken besser einzuschätzen und fundierte Handelsentscheidungen zu treffen.

Key FactDetails
IndikatorStandard Deviation Indikator
AnwendungMessung von Volatilität im Trading
BedeutungMisst Preisvolatilität um Mittelwert
BerechnungDurchschnitt der quadrierten Preisabweichungen
WichtigkeitHilft bei Risikomanagement und Entscheidungen
InterpretationHöherer Wert = höhere Volatilität, niedriger Wert = niedrigere Volatilität
ZusatznutzenIdentifizierung von Überkauft-/Überverkauft-Zuständen
VerknüpfungEng verbunden mit Bollinger Bands
PlattformVerfügbar in Metatrader 4 und 5
Ergänzende IndikatorenAverage True Range (ATR)

Einleitung zum Standard Deviation Indikator

Digitales Handelsumfeld mit Volatilitätsgraphen und Standardabweichungsindikator

Beim Handel an den Finanzmärkten ist es entscheidend, ein gutes Verständnis von Volatilität und Marktbewegungen zu haben. Ein Werkzeug, das hierbei oft zum Einsatz kommt, ist der Standard Deviation Indikator.

Dieser technische Indikator kann dir helfen, das Risiko besser zu managen. Informierte Entscheidungen zu treffen.

Was ist der Standard Deviation Indikator?

Der Standard Deviation Indikator, auf Deutsch Standardabweichungsindikator, ist ein statistisches Werkzeug. Das in der technischen Analyse eingesetzt wird, um die Volatilität eines Vermögenswertes zu messen.

Er zeigt, wie stark der Preis eines Assets um seinen Mittelwert schwankt. Eine höhere Standardabweichung bedeutet eine höhere Volatilität und damit größere Preisbewegungen.

Wie misst der Indikator die Volatilität?

Schachbrett der Finanzstrategie, beeinflusst durch Marktvolatilität

Volatilität beschreibt die Intensität der Preisveränderungen eines Assets über einen bestimmten Zeitraum.

Um die Volatilität zu messen, berechnet der Standard Deviation Indikator die Streuung der Schlusskurse um einen bestimmten gleitenden Durchschnitt.

Die Berechnung erfolgt in mehreren Schritten:

  1. Ermittlung des einfachen gleitenden Durchschnitts (Simple Moving Average, SMA) für eine festgelegte Periode.
  2. Berechnung der Abweichungen der einzelnen Schlusskurse vom gleitenden Durchschnitt.
  3. Quadrat dieser Abweichungen.
  4. Berechnung des Durchschnitts dieser quadrierten Abweichungen.
  5. Ziehen der Wurzel aus diesem Durchschnitt, um die Standardabweichung (STDDEV) zu erhalten.

Je höher der Wert der Standardabweichung ausfällt, desto volatiler ist der Markt. Ein niedriger Wert zeigt an, dass der Markt weniger volatil ist und die Preise nahe am gleitenden Durchschnitt liegen.

Trader nutzen diese Informationen, um zu entscheiden, ob der Markt gerade volatil und die Preise stark schwanken. Ob die Volatilität niedrig ist und eher stabile Bedingungen herrschen. Verstehen, wie man den Standard Deviation Indikator liest und interpretiert, ist für Trader ein Werkzeug, um Entry- und Exit-Points zu finden. Das Risikomanagement zu verbessern.

Grundlagen der Standardabweichung

A cartoon image depicting a financial analyst's workspace, emphasizing the importance of the Standard Deviation Indicator in market analysis. The scene shows a desk covered with financial reports, graphs, and a laptop displaying complex charts. One of the charts on the laptop screen prominently features the Standard Deviation Indicator, highlighting its role in analyzing market trends and volatility. The surrounding environment includes bookshelves filled with finance books, a coffee cup, and notes scribbled with key financial terms. This image portrays the meticulous nature of market analysis and the central role of the Standard Deviation Indicator in such assessments.

Definition von Standardabweichung

Die Standardabweichung ist ein Maß für die Streuung einer Reihe von Werten im Verhältnis zu ihrem Mittelwert. Sie gibt an, wie stark die einzelnen Werte von diesem Durchschnittswert abweichen.

In der Statistik ist sie ein zentraler Begriff, um die Varianz innerhalb einer Datenmenge zu verstehen.

Im Kontext des Tradings zeigt die Standardabweichung, wie weit der Kurs eines Vermögenswerts über eine bestimmte Zeit von seinem Mittelwert abweicht. Was ein Indikator für Volatilität ist.

Bedeutung der Standardabweichung im Trading

Händler analysiert Preisvolatilität mit Standard Deviation Indikator

Im Trading wird die Standardabweichung genutzt, um das Risiko von Preisbewegungen abzuschätzen. Volatilere Märkte weisen in der Regel eine höhere Standardabweichung auf. Was bedeutet, dass die Kurse stark schwanken und somit das Potenzial für höhere Gewinne, aber auch höhere Verluste steigt. Ein Verständnis für die Standardabweichung ermöglicht es Tradern, Positionen so zu wählen und zu managen. Die dem individuellen Risikoprofil entsprechen.

Berechnung des Standard Deviation Indikators

Erklärung der Berechnung des Standard Deviation Indikators im Trading

Die Berechnung des Standard-Deviation-Indikators erfolgt in mehreren Schritten. Die auf der historischen Preisentwicklung eines Assets basieren. Angenommen, du möchtest die Standardabweichung für einen 20-Tage-Zeitraum berechnen:

  1. Berechne den einfachen gleitenden Durchschnitt (SMA) für die letzten 20 Tage.
  2. Ermittle die Differenz zwischen jedem Schlusskurs und dem 20-Tage-SMA.
  3. Quadriere jede dieser Differenzen.
  4. Addiere alle quadrierten Differenzen.
  5. Teile die Summe durch die Anzahl der Tage (hier 20).
  6. Ziehe die Quadratwurzel aus dem Ergebnis, um die Standardabweichung zu erhalten.

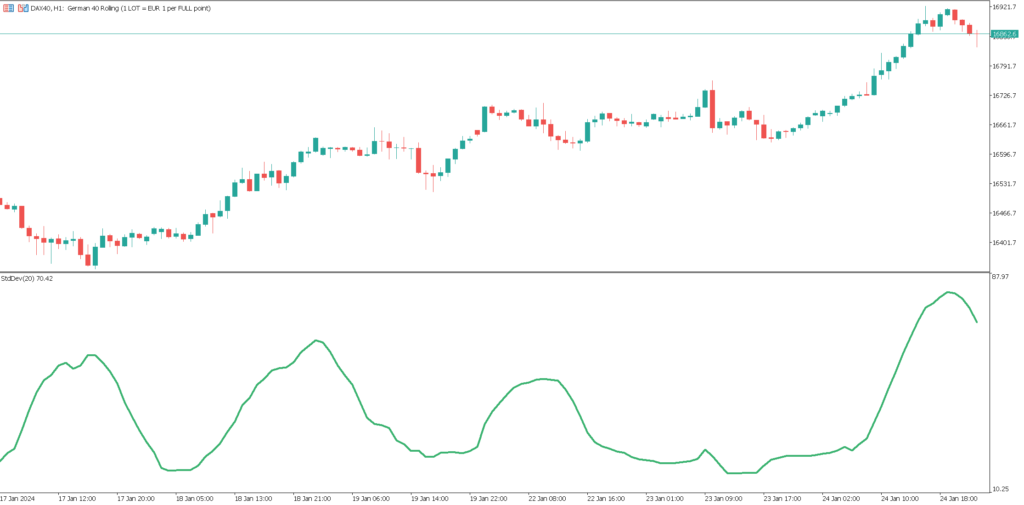
Interpretation der Werte des Indikators

A cartoon image depicting a trader sitting in front of multiple computer screens. The screens display various trading charts and graphs, with one screen specifically focusing on the Standard Deviation Indicator. The trader is analyzing the data, showing a mix of concentration and curiosity. The image captures the essence of trading with volatility using the Standard Deviation Indicator. The setting is an office environment with trading-related items like financial newspapers, a coffee mug, and pens around the trader.

Die Interpretation des Standard Deviation Indikators ist relativ geradlinig.

💡 Ein hoher Wert deutet auf eine hohe Volatilität hin, während ein niedriger Wert auf eine geringe Volatilität hinweist.

Trader beobachten insbesondere Änderungen in der Standardabweichung. Um zu erkennen, ob die Volatilität eines Marktes zu- oder abnimmt.

Die Standardabweichung kann auch genutzt werden, um Überkauft- oder Überverkauft-Zustände zu identifizieren. Liegt der Kurs deutlich über seinem gleitenden Durchschnitt, mit einer hohen Standardabweichung, kann dies auf einen überkauften Markt hinweisen. Möglicherweise eine bevorstehende Korrektur signalisieren.

A cartoon image illustrating the concept of the Standard Deviation Indicator in trading. The scene shows a trader in front of a large computer screen, displaying a graph with fluctuating lines representing market volatility. The graph has high peaks and low valleys, symbolizing high and low values of the Standard Deviation Indicator. The trader is focused, analyzing the data with a thoughtful expression. On the screen, there are annotations explaining key terms like 'Volatility,' 'Moving Average,' and 'Price Fluctuations.' The image is colorful and engaging, with an educational tone, making complex financial concepts accessible and easy to understand for beginners.

Ein Kurs deutlich unter dem Moving Average und eine hohe Standardabweichung kann auf einen überverkauften Markt hindeuten.

Diese Grundfunktionen können Trader verwenden, um spezifische Handelsstrategien zu entwickeln. Die auf den Prinzipien der Volatilitätsbewertung basieren.

Technische Indikatoren und ihre Beziehung zur Standardabweichung

Metatrader 5 - Mt5 - Standard Deviation und Bollinger Bands

Bollinger Bänder und Standard Deviation

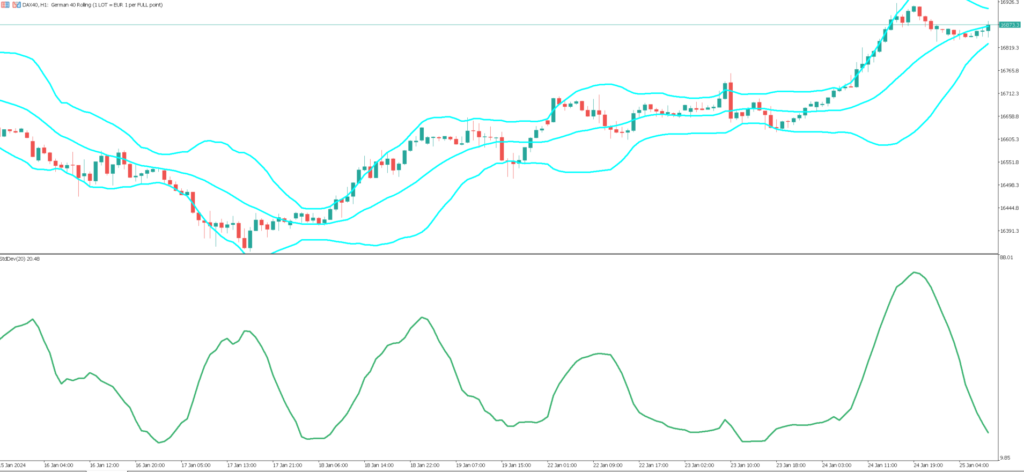
Die Bollinger Bands sind ein beliebter technischer Indikator. Der direkt mit der Standardabweichung verbunden ist. Sie bestehen aus drei Linien:

  • Dem Mittelband (ein einfacher gleitender Durchschnitt, SMA)
  • Einem oberen Band (SMA plus zwei Standardabweichungen)
  • Einem unteren Band (SMA minus zwei Standardabweichungen)
Trading-Klassenzimmer zeigt Verbindung zwischen Standard Deviation Indikator und Bollinger Bands

Diese Bänder passen sich automatisch der Volatilität des Marktes an. Da sie sich mit zunehmender Standardabweichung erweitern und bei abnehmender Standardabweichung zusammenziehen.

BandFormel
Mittelband20-Tage-SMA des Schlusskurses
Oberes BandMittelband + (2 x Standardabweichung)
Unteres BandMittelband – (2 x Standardabweichung)

Die Bollinger Bands liefern Hinweise auf potenzielle Überkauft- oder Überverkauft-Zustände und unterstützen bei der Identifizierung von Markttrends.

Moving Average (Gleitende Durschnitte)

MetaTrader 5- MT5 - DAX40 - Standard Deviation und Moving Average

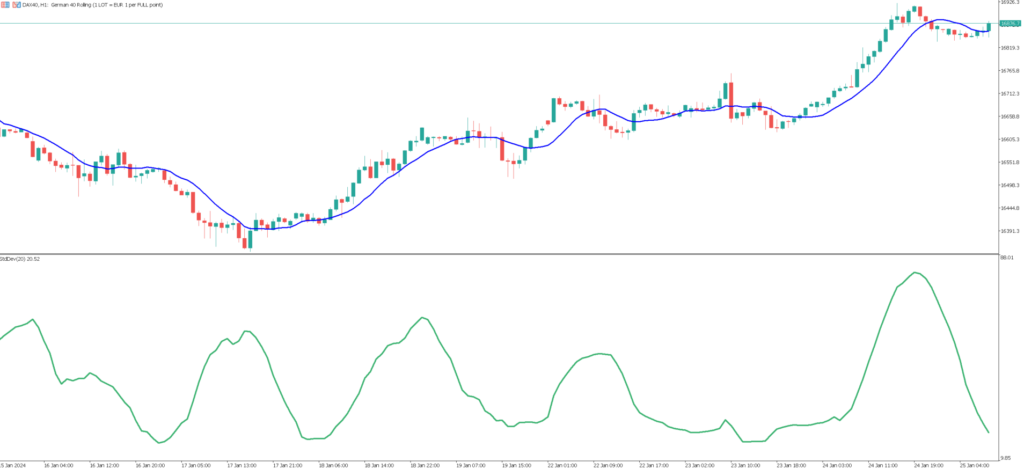
Der gleitende Durchschnitt (Moving Average) ist ein fundamentaler Bestandteil vieler technischer Indikatoren. Einschließlich der Bollinger Bands und des Standard Deviation Indikators.

Er hilft dabei, den Trend eines Marktes zu identifizieren. Indem er den Durchschnittspreis über eine festgelegte Periode glättet. Es gibt verschiedene Arten von gleitenden Durchschnitten. Den einfachen gleitenden Durchschnitt (SMA) und den exponentiellen gleitenden Durchschnitt (EMA). Wobei jeder unterschiedliche Eigenschaften aufweist und für verschiedene Analysezwecke genutzt wird.

Metatrader und der Standard Deviation Indikator

MetaTrader 5 - MT5 - Standard Deviation Indikator

Metatrader ist eine weitverbreitete Plattform für technische Analysen. Bietet eine Vielzahl von Indikatoren für das Trading.

Metatrader als Plattform für technische Analysen

MetaTrader 5 - MT5 - Einstellungen Standard Deviation

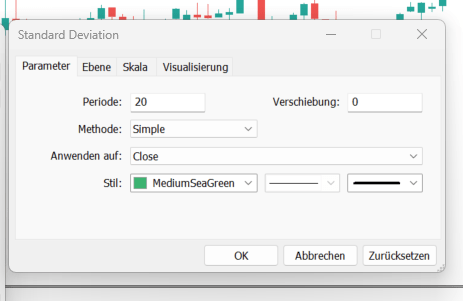
Im Metatrader 4 (MT4) und Metatrader 5 (MT5) ist der Standard Deviation Indikator vorinstalliert.

Die Standard Einstellungen sind Periode 20. Alle Werte kannst du jederzeit anpassen.

Einrichten des Standard Deviation Indikators in Metatrader

Das Einrichten des Standard Deviation Indikators in Metatrader ist unkompliziert.

  1. Öffne Metatrader und wähle den gewünschten Chart aus.
  2. Klicke im Menü auf „Einfügen“, wähle „Indikatoren“ und dann „Tendenz“.
  3. Finde und wähle „Standard Deviation“ aus der Liste.
  4. Konfiguriere die Einstellungen des Indikators nach deinen Vorlieben. Wie die Periode, über die die Standardabweichung berechnet werden soll.
  5. Bestätige deine Einstellungen und der Indikator wird im Chart angezeigt.

Trading mit dem Standard Deviation Indikator

Digitales Dashboard zur Visualisierung von Marktvolatilität und -risiko

Für Trader ist es entscheidend, die Volatilität des Marktes zu verstehen. Um Risikomanagement und Handelsentscheidungen zu optimieren. Der Standard Deviation Indikator liefert wichtige Hinweise auf das gegenwärtige und zukünftige Marktverhalten.

Ein Anstieg der Standardabweichung signalisiert eine Zunahme an Volatilität. Was größere Preisbewegungen und somit höhere Gewinn– oder Verlustchancen bedeutet. Umgekehrt deutet ein Rückgang auf eine abnehmende Volatilität und stabilere Marktkonditionen hin.

Erkennen von Trendstärke und -schwäche

Trader verwendet Standard Deviation Indikator auf Metatrader Plattform

Neben der Bewertung der Volatilität hilft der Standard Deviation Indikator auch dabei, die Stärke eines Trends zu beurteilen.

💡 Tendenziell gilt: Je höher die Volatilität, desto stärker ist der zugrundeliegende Trend.

Preise die sich konsistent in eine Richtung bewegen und eine hohe Standardabweichung aufweisen, können auf einen starken Trend hindeuten.

Eine niedrige Standardabweichung mit geringen Preisänderungen kann auf eine Trendschwäche oder eine Seitwärtsbewegung im Markt hinweisen.

Entwicklung eigener Handelsstrategien

3D-Balkendiagramm der Marktvolatilität mit Fokus auf Standardabweichung

Mit dem Verständnis für die Standardabweichung und den Einfluss Marktdynamik können Trader eigene Handelsstrategien entwickeln.

Sie können entscheiden, ob sie in Zeiten hoher Volatilität handeln möchten. Was eventuell höhere Gewinne aber auch höhere Risiken birgt.

Ob sie in ruhigeren Marktphasen mit niedriger Volatilität tätig werden. Der Indikator kann helfen, Entry- und Exit-Punkte zu bestimmen. Indem Positionen eröffnet werden, wenn die Volatilität beginnt zu steigen, und geschlossen werden, wenn sie abnimmt.

Nutzung verfügbarer Bibliotheken für effektiveres Trading

Viele Trading-Plattformen wie Metatrader und TradingView bieten Bibliotheken mit vorgefertigten Indikatoren und Strategien. Die auf der Standardabweichung basieren.

TradingView - Standard Deviation

Trader können diese Bibliotheken nutzen, um sich mit verschiedenen Handelsansätzen vertraut zu machen. Diejenigen auszuwählen, die ihren Handelsstil und ihre Ziele am besten unterstützen.

Im MetaTrader heißt die Homepage MQL5.com. Dort findest du neben Indikatoren auch Skripte oder automatisierte Handelssysteme. In der Regel sind diese Tools kostenfrei. Du kannst dir die Indikatoren auch direkt in der Handelsplattform installieren.

Nachteile der Verwendung des Standard Deviation Indikators

Achterbahn der Finanzmärkte symbolisiert durch Standardabweichungsindikato

Während der Standard Deviation Indikator wertvolle Einblicke in die Volatilität eines Marktes bietet, hat er auch Grenzen.

Er reagiert nur auf Preisänderungen und berücksichtigt keine Richtung des Trends.

Er kann bei einem starken Aufwärtstrend genauso hohe Werte anzeigen wie bei einem starken Abwärtstrend. Der Indikator ist ein nachlaufendes Werkzeug, das auf historischen Daten basiert. Er liefert verzögerte Signale, die nicht immer die aktuellen Marktbedingungen widerspiegeln.

Risiken bei falscher Interpretation

Schiff navigiert durch stürmische Finanzmärkte

Eine falsche Interpretation des Indikators kann zu ungenauen Schlussfolgerungen und potenziell zu Verlustgeschäften führen.

Eine hohe Standardabweichung stellt nicht automatisch eine Handelsgelegenheit dar. Berücksichtige den Kontext des Marktes und weitere Indikatoren. Um zu verstehen, ob eine hohe Volatilität auf eine bevorstehende Trendwende oder auf eine Fortsetzung des aktuellen Trends hindeutet.

Average True Range als Ergänzung zum Standard Deviation Indikator

MetaTrader 5 - MT5 - ATR und Standard Deviation

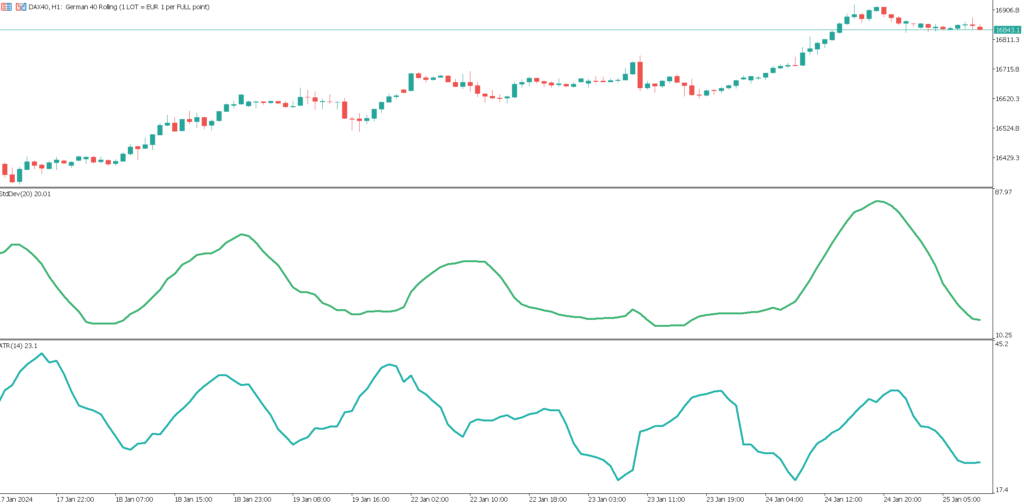
Der Average True Range (ATR) Indikator ist ein weiteres Instrument, das genutzt wird, um die Volatilität des Marktes zu messen.

Im Gegensatz zur Standardabweichung, die die Varianz der Preise um einen Mittelwert betrachtet, fokussiert sich der ATR auf die tatsächliche Preisspanne eines Assets. Einschließlich jeglicher Kurslücken, die zwischen Handelssitzungen auftreten können.

Dies macht den ATR zu einem nützlichen Indikator für die Bewertung der Marktvolatilität. Gerade in Märkten, in denen Kurslücken (Gaps) häufig vorkommen.

Kombinieren beider Indikatoren zur Markteinschätzung

A cartoon image of a trader sitting at a desk with multiple computer screens displaying charts and graphs. One of the screens prominently features the Standard Deviation Indicator with noticeable volatility. The trader appears focused and is analyzing the data. The environment is an office setting with trading related books and notes on the desk. The image should capture the essence of a trader utilizing technical analysis tools to make informed decisions.

Die Kombination des Standard Deviation Indikators mit dem ATR kann eine umfassendere Sicht auf die Volatilität und das Risiko eines Marktes bieten.

Der Standard Deviation Indikator zeigt die Variabilität der Preisbewegungen um einen Durchschnittswert. Der ATR gibt Aufschluss über die durchschnittliche Preisspanne, die ein Asset über einen bestimmten Zeitraum hinweg durchläuft.

Beide Indikatoren können Tradern ein tieferes Verständnis für die Dynamik des Marktes liefern. Damit die Handelsstrategien entsprechend anpassen. Um ihre Chancen zu verbessern und das Risiko zu minimieren.

Händler vergleicht Standard Deviation und ATR Indikatoren im Trading

Fazit: Lohnt sich der Standard Deviation Indikator für Trader?

Der Standard Deviation Indikator ist ein wertvolles Tool für Trader, um die Volatilität eines Marktes zu beurteilen. Er ermöglicht es, die Intensität der Preisbewegung eines Vermögenswerts zu verstehen.

Dieser Indikator, der oft in Kombination mit Trend-Indikatoren und Bollinger Bands verwendet wird, ist entscheidend für die Berechnung der Volatilität. Hilft dabei, überkaufte oder überverkaufte Bedingungen zu erkennen.

Eine hohe Standardabweichung weißt auf einen volatilen Markt hin. Das bedeutet, dass die Preise und die Kerzen starke Schwankungen zeigen. Dies kann für Trader ein Signal sein, dass der Markt volatil und die Preise stark schwanken. Was sowohl Chancen als auch das Risiko, schnell Geld zu verlieren, birgt.

Ein hoher Wert zeigt an, dass der Markt volatil ist und die Kerzen weit vom Durchschnittspreis entfernt sind. Dies kann auf eine Stärke oder Schwäche des aktuellen Trends hindeuten. Ist damit ein wichtiges Signal für das Setzen von Entry und Exit Points.

Dieser Beitrag hat 87 Kommentare

  1. tlover tonet

    Valuable info. Lucky me I found your web site by accident, and I am shocked why this accident did not happened earlier! I bookmarked it.

  2. Ellamae Counce

    Thanks for your personal marvelous posting! I definitely enjoyed reading it, you happen to be a great author.I will always bookmark your blog and will often come back in the foreseeable future. I want to encourage continue your great work, have a nice holiday weekend!

  3. FitSpresso Review

    I’ve been absent for a while, but now I remember why I used to love this website. Thank you, I will try and check back more frequently. How frequently you update your site?

  4. cbd kapseln kaufen

    Thanks, I have just been looking for info about this topic for a while and yours is the best I have came upon till now. But, what concerning the bottom line? Are you certain about the supply?

  5. slot gacor

    Howdy very cool site!! Man .. Beautiful .. Amazing .. I’ll bookmark your website and take the feeds also?KI’m satisfied to seek out so many helpful information here within the put up, we’d like work out more techniques in this regard, thanks for sharing. . . . . .

  6. Spoo-Design

    I am not sure where you’re getting your info, but great topic. I needs to spend some time learning much more or understanding more. Thanks for excellent information I was looking for this information for my mission.

  7. gesichtscremes

    I love it when people come together and share opinions, great blog, keep it up.

  8. make-up dm

    Very nice pattern and wonderful content material, absolutely nothing else we require : D.

  9. hire a hacker dark web

    Usually I do not read post on blogs, but I would like to say that this write-up very compelled me to check out and do so! Your writing style has been amazed me. Thanks, quite great post.

  10. DEEP eventlocation

    I discovered your blog site on google and check a few of your early posts. Continue to keep up the very good operate. I just additional up your RSS feed to my MSN News Reader. Seeking forward to reading more from you later on!…

  11. görükle escort

    Nice post. I learn something more challenging on different blogs everyday. It will always be stimulating to read content from other writers and practice a little something from their store. I’d prefer to use some with the content on my blog whether you don’t mind. Natually I’ll give you a link on your web blog. Thanks for sharing.

  12. Hey I am so thrilled I found your blog page, I really found you by error, while I was looking on Askjeeve for something else, Anyways I am here now and would just like to say kudos for a marvelous post and a all round exciting blog (I also love the theme/design), I don’t have time to look over it all at the moment but I have bookmarked it and also added in your RSS feeds, so when I have time I will be back to read much more, Please do keep up the excellent work.

  13. lotterydefeater review

    I actually wanted to compose a quick message so as to appreciate you for all of the amazing concepts you are placing at this website. My extensive internet investigation has now been honored with brilliant details to go over with my friends and classmates. I ‚d assume that many of us website visitors are undeniably blessed to dwell in a notable site with very many perfect individuals with helpful principles. I feel pretty happy to have come across your entire site and look forward to really more fabulous moments reading here. Thank you once more for all the details.

  14. SightCare

    You can definitely see your expertise in the work you write. The world hopes for even more passionate writers like you who are not afraid to say how they believe. Always follow your heart.

  15. private investigator

    you may have an excellent weblog here! would you like to make some invite posts on my weblog?

  16. istanbul escort

    Fantastische Website, sehr benutzerfreundlich!

  17. bursa escort

    I haven’t come across such a comprehensive and high-quality site in a long time. You are awesome!

  18. rinderschwanz

    Wow! Thank you! I continually needed to write on my site something like that. Can I take a fragment of your post to my blog?

  19. fitspresso reviews

    I love it when people come together and share opinions, great blog, keep it up.

  20. Dead written content material, thanks for entropy. „The earth was made round so we would not see too far down the road.“ by Karen Blixen.

  21. I have been browsing on-line greater than three hours as of late, but I by no means discovered any fascinating article like yours. It is beautiful worth sufficient for me. In my opinion, if all site owners and bloggers made just right content material as you probably did, the net shall be much more helpful than ever before.

  22. vogeltränke keramik

    I’m not that much of a internet reader to be honest but your blogs really nice, keep it up! I’ll go ahead and bookmark your site to come back down the road. All the best

  23. vogeltränke granit

    I want to express appreciation to the writer just for bailing me out of this particular setting. As a result of looking out throughout the internet and getting proposals which were not powerful, I thought my life was done. Existing minus the strategies to the difficulties you’ve sorted out as a result of this guideline is a serious case, and those that might have in a negative way damaged my entire career if I hadn’t encountered your website. Your actual ability and kindness in playing with all things was invaluable. I am not sure what I would have done if I hadn’t discovered such a solution like this. I can at this moment look forward to my future. Thanks a lot so much for this expert and sensible help. I will not be reluctant to endorse your web page to any individual who should receive guidelines about this topic.

  24. izmit escort haberleri

    Incredibly informative and entertaining site. I highly recommend it to everyone!

  25. santa rosalia resort

    Excellent goods from you, man. I have understand your stuff previous to and you are just extremely wonderful. I really like what you’ve acquired here, really like what you are saying and the way in which you say it. You make it enjoyable and you still care for to keep it sensible. I can’t wait to read far more from you. This is actually a great web site.

  26. eskort bayan

    �nan�lmaz derecede bilgilendirici ve e�lenceli bir site. Herkese tavsiye ederim!

  27. klebefolie möbel

    Some times its a pain in the ass to read what blog owners wrote but this internet site is really user pleasant! .

  28. aufstellpool

    Glad to be one of the visitors on this awing web site : D.

  29. pools set

    I’m not sure where you are getting your information, but great topic. I needs to spend some time learning more or understanding more. Thanks for excellent information I was looking for this information for my mission.

  30. oval pool kaufen

    Simply wanna comment on few general things, The website style and design is perfect, the written content is real excellent : D.

  31. Cellu care reviews

    Do you mind if I quote a few of your posts as long as I provide credit and sources back to your blog? My blog site is in the exact same niche as yours and my visitors would really benefit from some of the information you provide here. Please let me know if this okay with you. Thank you!

  32. bursa anal yapan escort

    Bu siteye bay�l�yorum! G�ncel ve faydal� bilgilerle dolu. Eme�i ge�en herkese te�ekk�rler.

  33. 株価 マクニカ

    It was certainly hard to miss with its bold three-bar grille, a signature destined for future Ford cars (plus an early Five Hundred facelift) and a dim nod to 1966 Galaxies.

  34. 政策金融機関

    Costs of Chemicals Archived 26 July 2010 at the Wayback Machine.

  35. escort kizlar

    Uzun zamand�r b�yle kapsaml� ve kaliteli bir siteye rastlamam��t�m. Harikas�n�z!

  36. escort haberleri

    Görsel olarak çarpıcı ve oldukça işlevsel.

  37. ツボすぎる意味

    Whether the look is dramatic or serene, contemporary style at its best conveys an uplifting spirit of freshness and freedom.

  38. 日本消防

    This page was last edited on 13 October 2019, at 23:07 (UTC).

  39. You made some decent points there. I looked on the internet for the issue and found most individuals will agree with your blog.

  40. 大学 メール なんj

    1. Do your homework and do it well; the information this provides will enable you to measure a country’s economic growth.

  41. せん ごく っ

    Click on the links below to read more about the various types of knitting projects you can create on your own, even with very little experience.

  42. ガーシュイン 子供

    Many companies are so serious about not being included in social networking sites that they forbid employees from using sites like Facebook at work.

  43. A single pine tree, approximately 1 foot (0.3 meters) in diameter and 60 feet (18.3 meters) tall, can produce about 80,500 sheets of paper.

  44. During 1944, resistance groups exasperated the Germans by establishing several provisional governments in northern Italy.

  45. となる 例文

    Options- It Grants the right, but no compulsion, to buy or sell a futures contract at a planned price for a particular period of time.

  46. Most of the time, stock rises in value, but analysis of their movement is very difficult, Investors buy many lot sizes (1 lot 100 shares) for long-term to take advantage to grow their profits over time.

  47. Unlike ISDA which I have visited most years I have never been to this conference before as our main derivatives business has been in the OTC derivatives market, including the collateral management and valuation of these instruments.

  48. escort bursa

    This site is truly addictive! Always filled with current and interesting content.

  49. gorukle escort

    Her ziyaretimde yeni bir �ey ��reniyorum. ��erikler �ok �zenli ve profesyonelce haz�rlanm��.

  50. fiscaal recht

    Hi , I do believe this is an excellent blog. I stumbled upon it on Yahoo , i will come back once again. Money and freedom is the best way to change, may you be rich and help other people.

  51. They could become a traditional family source of income for the children together with very good securities after job loss.

  52. This quantity has come down from the premium of the early days of hybrids, however it is nonetheless a significant factor when making a call to purchase a automobile, even with monetary incentives.

  53. As an outdoor enthusiast who has encountered several life threatening situations, I understand the importance of having the right equipment.

  54. It has also change into one of the quickest growing financial centres following the late-2000s recession, helped by the stability of the Canadian banking system.

  55. London tantric massage

    you have a great blog here! would you like to make some invite posts on my blog?

  56. London tantric massage

    It’s actually a nice and helpful piece of information. I’m satisfied that you shared this useful information with us. Please stay us informed like this. Thank you for sharing.

  57. 28カレンダー

    In the United States, the Tax Equity and Fiscal Responsibility Act of 1982 substantially curtailed the issue of debt in bearer form: it also disallowed any tax deduction of interest paid on any such bonds issued after 1982 by the issuer in the case of corporate bonds and removed the tax exemption of the interest paid in the case of municipal bonds, with registered bonds retaining the tax-exempt treatment.

  58. 7 月 決算 高 配当

    This index is one of the main instruments for day trading, meaning, for multiple purchases and sales in a single day.

  59. 一生を終える 意味

    The prices of options are determined during an option pricing model relative to the current exchange rates.

  60. Flexibility – Nearly all share traders will inform you that share allow for suppleness in your trading.

  61. solarleitung DN 20

    I like what you guys are up too. Such intelligent work and reporting! Keep up the excellent works guys I have incorporated you guys to my blogroll. I think it’ll improve the value of my website :).

  62. トー横 キッズ

    Directorate-General for Communication. „Establishments, regulation, funds | The Euro | Design“.

  63. 春の高山祭 2015

    Because of the real property collapse, prices had bottomed out and interest rates had been at historic lows.

  64. 満州 きつ こ

    ​Data has be​en created  wi th GSA Con​tent G​enerator Dem ov er᠎si on.

  65. Cellucare

    I was looking through some of your content on this internet site and I think this website is rattling informative! Retain posting.

  66. bursa escort

    This site is truly addictive! Always filled with current and interesting content.

Schreibe einen Kommentar